Wednesday, 13 July 2022

Learning Difficulties and Reading Comprehension in the First Grades of Primary School by Theofilidis Antonis* in Open Access Journal of Biogeneric Science and Research

Learning Difficulties and Reading Comprehension in the First Grades of Primary School by Theofilidis Antonis* in  Open Access Journal of Biogeneric Science and Research 


ABSTRACT

This paper is a study on the concept of learning disabilities and reading comprehension. Specifically, it studies the learning difficulties and the reading ability in terms of the school performance of the students of the first grades of primary school.

Aim: In our work we try to analyze and present the following topics:

The definition of the term "Learning Disabilities", their etiology and the correlation of learning difficulties and reading.

What learning difficulties do,what we face in reading and writing and how do they affect the school context and students' performance.

How to diagnose learning disabilities in reading ability and interventions that need to be implemented in the classroom to reduce them.

Method: We followed the most up-to-date literature on the subject

Conclusions: Learning difficulties can also cause emotional problems in children as they feel that they are lagging behind compared to the rest of the class. Our goal is to include children with learning disabilities in the classroom by adapting the lesson to the children and not the children in it. Our main concern should be the valid and timely diagnosis of difficulties and effective intervention to address them.

Keywords: Learning difficulties, reading comprehension, primary school

LEARNING DIFFICULTIES - DEFINITION AND ETIOLOGY

Learning disabilities are a generalized expression of some of the individual difficulties encountered by students. More specifically, the concept of learning disabilities refers to a variety of heterogeneous disorders, which result in difficulty in learning, speaking, writing, reading, information processing, mathematical computation, attention retention and in the coordination of movements. Every disorder that is part of the learning disability is differentiated in terms of the intensity of its manifestation, the nature and the symptoms of the difficulties, as well as the consequences that they have. These disorders can cause problems throughout the life of the individual [1]. An important point in the study of learning difficulties concerns the impossibility of having common symptoms of expression of these difficulties, a fact that leads to their delayed recognition, which usually occurs during school age [2].

The goal of any educational system is the success of students in their academic performance, as well as their acceptance by the school environment. Many children, however, who have learning difficulties do not have the expected school performance required. The learning difficulties that can occur to each child individually vary, which makes the role of the teacher difficult, since he is called to deal with each case separately [3].

The origin of learning difficulties seems to be mainly due to dysfunction in the central nervous system of the individual [5]. Thus, learning disabilities come through the pathogenesis of the individual himself. However, apart from the neurological factors that seem to play a major role in the development of learning disabilities, the great heterogeneity of the symptoms of learning disabilities leads, however, many researchers to conclude that the etiology of these difficulties is very likely to be multifactorial and epigenetic factors also play a role. More specifically, researchers should not neglect the study of environmental, cultural and emotional factors, processes that seem to play a significant role in the occurrence of learning disabilities. Such factors may be an inappropriate school environment, a difficult family environment, depression, anxiety, the child's personality, psychological neglect, etc. Still, we should not overlook the cognitive factors that emerge through low performance in almost all learning activities. In addition, there seems to be a differentiation of learning difficulties in relation to the sex of the child. In contrast to girls, boys have a higher rate of learning difficulties especially in the behavioral field and language learning [4]. Therefore, as learning is a complex, multifactorial process, all the complex factors that may affect it should be considered. However, all of the above have not yet been clarified in the literature whether they are factors that cause learning disabilities or simply predisposing or risk factors [6].

Papadakou, Palili, Gini, (2014) studied some epidemiological factors that seem to be directly related to the occurrence or not of learning difficulties. The research process showed that children diagnosed with learning disabilities had at least one first-degree relative with learning disabilities. The researchers also found that learning disabilities were directly linked to sleep disorders, attention deficit hyperactivity disorder (ADHD), and a variety of other emotional and social problems. Such problems may be related to anxiety, depression, adaptive disorders and social interaction, etc. The researchers emphasize that the above factors could be considered as prognostic and gain important function in the design of targeted early interventions, with the aim of better academic and social development [7].

Finally, the correlation of learning difficulties with various emotional problems that children may manifest is considered important. Although no precise explanation has been given, it seems that children with learning disabilities tend to develop less positive and more negative emotions, which reduce their willpower and prevent them from making the necessary effort in the school context. (Gugumi, 2015). Behavioral problems can be characterized as internal and external. Problems such as stress, melancholy, depression, obsessive-compulsive disorder, dysthymia and social phobia, as well as disorders such as bulimia, nightmares, anorexia, shyness and isolation are considered internal, while problems such as aggression are considered. Disasters, negativity, rudeness, attention deficit hyperactivity disorder, adjustment and conduction disorders, hostility and theft, are considered external problems [8]. Bornstein, Hahn & Suwalsky, 2013). Children's intrapersonal or interpersonal adjustment is directly affected by these emotional and behavioral problems, which may be due to students' low self-esteem, which stems from the learning difficulties they face (Koliadis, 2010).

LEARNING DISABILITIES AND READING

Most of the children who have Learning Disabilities have problems in the cognitive process of reading and understanding the written text. The process of reading is a complex task of cognitive function, which refers to the processing and analysis of graphs, phonemes and semantic information of the written language. It is closely related to a variety of other cognitive functions of the child, which must be activated for the full understanding of reading, such as the degree of ability of his phonological awareness and the capacity of his short-term memory, perception, concentration, attention, language and thinking, as well as sensory skills such as vision, motor and reading ability [9] Natália Jordão, Adriana de Souza Batista Kida, Danielle Dutenhefner de Aquino, Mariana de Oliveira Costa, & Clara Regina Brandão de Avila. 2019). More specifically, reading refers to the process in which the student decodes the written symbols of our language and converts them into speech. The graphic processing of these written symbols can contain phonemic, phonological and semantic information about the receiver (Porpodas, 2002).

In order for the reading process to take place correctly, it is necessary not only to decode the imprinted symbols, but also to understand their conceptual content. It is thus an important process of processing and extracting information, deeply connected and dependent on decoding and understanding (Porpodas, 2002. Tsesmeli, S. 2012).

We understand, then, that decoding and comprehension are the two most important cognitive functions that play the most important role in the reading process. More specifically, decoding is the ability to recognize written symbols and automatically convert them to a phonological representation. An important role in the correct decoding is played by the state of long-term memory, access to it and retrieval of any information necessary for the correct letter-phonemic matching [19] (Tzivinikou, S. 2015. Kim, MK, Bryant, DP, Bryant, BR, & Park, Y. 2017) [11]. Comprehension, which is the second equally important cognitive function of reading, presupposes the recognition of the semantic content of words, which can come from the knowledge of the meaning of words, the understanding of their grammatical pronunciation as well as their syntactic structure (Kokkinaki 2014. Westwood, 2016). For the correct understanding of the text, the cognitive strategies should be used correctly, the words of the text should be recognized and combined with the previous knowledge [12] (Westwood, 2016. Tzivinikou, 2015) [13]. According to Kaldenberg, Watt, & Therrien, (2015) reading comprehension is directly related to the reader's prior knowledge, as the information obtained from a text in order to be generalized and understood, must be processed and to connect based on the knowledge already possessed by the individual. Lack of this knowledge leads to inability to use metacognitive strategies needed for reading (Kaldenberg et al., 2015) [14].

Reading, then, can be said to be the product of these two factors presented above, decoding and comprehension. As a result, any malfunction even in one of these two factors can lead to the so-called Reading Difficulties. Difficulty in reading comprehension can manifest itself throughout the levels of the reading process, from the simple learning of individual graphs to the reading, comprehension and retention of the acquired textual information. The reading difficulties that children present are mainly based on neurological abnormalities, they can be combined with delayed speech and generally with language problems (Kokkinaki 2014).

LEARNING DIFFICULTIES AND READING IN PRIMARY SCHOOL

In terms of reading comprehension in the school performance of primary school students we must keep in mind the basic cognitive development of the reading process. A student is expected to have successfully completed the decoding ability by the second grade of elementary school. By the third grade, a child should not only be able to easily decode the written text, but also understand the meaning of what they are reading. With this in mind, we can talk about learning difficulties related to reading comprehension, only if the child has received the appropriate education for the stage of the class in which he is. The usual deviation of students with learning disabilities from the rest of the class is about one to two years.

Learning disabilities seem to slow down children's performance at school. The motivation and enthusiasm that each student has for learning, does not seem to exist in students with learning difficulties, resulting in a low academic level [15] (Lama, 2019). We understand, then, that the early diagnosis and treatment of learning difficulties in a child in the first grades of primary school is vital. The main problem lies in the field of decoding since the difficulty of the reader to decode the words hinders his entry into the process of comprehension (Kokkinaki 2014) [16].

LEARNING DIFFICULTIES AND WRITING SPEECH PROBLEMS IN PRIMARY SCHOOL

The role of writing in school is very important since apart from being a means of communication it is also one of the basic skills that will accompany the child throughout his student years and later in life. A necessary criterion for the production of written speech is the linguistic, metalanguage but also the cognitive, metacognitive skills of the individual. An important role in the production of written speech is played by the already existing knowledge and experiences of the individual, his motivations, feelings and goals (Panteliadou 2000. Vasarmidou, D., & Spantidakis, I. I. 2015). Students with learning disabilities have difficulty using metacognitive strategies that should be employed to produce written communication. These strategies would give the student the opportunity in the writing process, would help him in the production and in the end would give him the opportunity to check his result and evaluate it, allowing him to make the necessary corrections (Panteliadou, 2000. Vasarmidou , 2015).However, in addition to cognitive and metacognitive skills, difficulties may also arise in the student's mechanistic skills. These skills include handwriting, spelling, vocabulary development and the use of punctuation, accentuation, writing and the use of uppercase and lowercase letters. Difficulties in some of these skills or in all, create problems in writing [17] (Vasarmidou, 2015. Panteliadou, 2000). Also, features of written speech difficulty can be the reversal or confusion of letters, omissions or additions of letters, illegible letters and permutations. Identifying more serious issues related to speech and reading in combination with writing is much more complicated than the first grade of elementary school, since the difficulty in organizing speech is something common in preschool children (Tzouriadou, 2008) [18].

DIAGNOSIS AND TEACHING INTERVENTIONS IN CHILDREN WITH LEARNING DISABILITIES

There are many cases of students with learning difficulties who have the ability to keep up with the class schedule without particular problems. However, in most cases, the difficulties are quite intense, as a result of which the content needs to be adjusted in order to be able to follow it [20] (Tzouriadou, 2011).

Learning Disabilities are a common problem for many students, but due to their special nature, they enable us to carry out effective intervention programs. This intervention must be timely, in order to deal with the current difficulty in giving birth, as well as not to create negative feelings regarding the self-esteem, self-image and self-confidence of children for their abilities and school performance. Proper intervention comes from a valid assessment of students' dysfunctions and weaknesses and is a multifactorial process, which requires adequate knowledge of the child's weaknesses, strengths and personality, cooperation with parents, study of social, family and cultural environment of the child, as well as many other important information (Porpodas, 2002). Assessment in terms of cognitive objects should be based on phonological awareness, short-term memory, decoding and finally, comprehension of the reported text (Kokkinaki 2014).

Therefore, a necessary condition for an effective didactic intervention is the correct diagnosis. Specifically, for reading ability, starting with a well-targeted assessment based on the difficulties we detect in the child, we give a specialized approach to the teaching of reading. In order to make this assessment, we must take as a guide the level of reading ability that the student already possesses. The correct evaluation in the kindergarten and in the first grades of elementary school leads to a timely intervention and prevention of the student's difficulties [19] (Tzivinikou, S., 2015).

Today, we are given the opportunity, with the use of appropriate tools, to understand the learning difficulties that a child faces from an early age. Some of the most common screening tests that are mainly related to reading ability are:

  • The Predictive Assessment of Reading (PAR). It is considered one of the most reliable and valid tests for kindergarten children, through which we have the ability to predict the reading ability of children up to high school.
  • The Texas Primary Reading Inventory (K-2). It focuses on children from pre-school to the third grade and has the ability to recognize and evaluate the developmental stages of their reading [21].
  • The Dynamic Indicators of Basic Early Literacy Skills (DIBELS). It is a test that deals with the processes of phonemic awareness, the alphabetic principle and phonological awareness, the ease and accuracy of reading a text, the development of vocabulary and the process of comprehension.

Finally, the AIMS-Web test, which enables the use of RtI programs and multilevel teaching in schools. It refers to children from kindergarten to high school and gives a basis for the detailed curriculum in mathematics and reading [21] (Tzivinikou, S., 2015)

So, after completing our diagnosis and evaluating the capabilities and needs of the student, we turn to the right teaching intervention. In order to eliminate the differences between the students, we focus on adapting the curriculum to the needs of the student and not the other way around. Thus, the goals we have set in a classroom do not change according to the abilities of each student, but the way they are approached and their degree of difficulty differ (Skidmore 2004). The ultimate goal is to develop learning strategies and use them within the classroom. Strategies such as group research or peer-to-peer teaching can be particularly useful, not only for students with difficulties but also for all students in the class (Tzouriadou, 2011). By learning to use cognitive and metacognitive strategies, students have the opportunity to process and use the information they will receive, to think and perform a task, and to evaluate their performance in it [22] (Luke 2006).

Students with reading difficulties can improve their reading skills through various educational approaches applied during teaching. Indicatively, we can refer to direct teaching, the formation of small groups that enhance discussion and support, vocal thinking, etc. (Tzivinikou, 2015). Also, strategies that have to do with reading are:

  • The Reading Analysis, Merge and Decoding strategy. It refers to students with learning difficulties aged 7 to 12 years and has to do mainly with the connection of sounds with voices.
  • Auditory Discrimination in Depth. It emphasizes the posture of the mouth and they learn the feeling that each sound gives at the time of its pronunciation. Thus, students analyze the words and recognize the sounds according to the placement of the tongue and mouth.
  • Analysis for Decoding Only. A strategy that is implemented in order to teach students to analyze letter patterns in small words that they often come across. For example, the word "beyond" combined with the words "day, wedding ring, good morning".
  • The Read-By-Ratio Approach. This strategy is based on phonemes aimed at word recognition. Through the same spelling patterns of words, students are taught how to analyze and decode unknown words (Tzivinikou, 2015).

CONCLUSIONS

In recent years, there has been a rapid increase in learning disabilities. The percentage of children diagnosed with learning disabilities, which can cause serious developmental problems within and outside the school context, is increasing. Children who have been diagnosed with learning disabilities appear to have serious difficulty adapting to the classroom and thus lagging behind in their academic performance. In the past there was a perception that these children were "lazy", "bad students", "stupid", but now we know that this perception is wrong, since we are not talking about bad or lazy students, but about students who due to a nervous disorder their system, do not have the same capabilities as the rest. Learning difficulties can also cause emotional problems in children as they feel that they are lagging behind compared to the rest of the class. Our goal is to include children with learning disabilities in the classroom by adapting the lesson to the children and not the children in it. Our main concern should be the valid and timely diagnosis of difficulties and effective intervention to address them.

More information regarding this Article visit: OAJBGSR


https://biogenericpublishers.com/pdf/JBGSR.MS.ID.00255.pdf
https://biogenericpublishers.com/jbgsr-ms-id-00255-text/

Complex Kinesiological Conundrum Could Microzyman Machinations/Inhibitions Explain the Relative Tardiness of Initial Infantile Human Locomotion? Seun Ayoade* in Open Access Journal of Biogeneric Science and Research

Complex Kinesiological Conundrum Could Microzyman Machinations/Inhibitions Explain the Relative Tardiness of Initial Infantile Human Locomotion? Seun Ayoade* in  Open Access Journal of Biogeneric Science and Research 


ABSTRACT

“The onset of walking is a fundamental milestone in motor development of humans and other mammals, yet little is known about what factors determine its timing. Hoofed animals start walking within hours after birth, rodents and small carnivores require days or weeks, and nonhuman primates take months and humans approximately a year to achieve this locomotor skill”.

Introduction

We, mankind, are the tardiest living thing in terms of the age we start walking. This is highly embarrassing. It is embarrassing to evolutionists who declare man to be the most biologically advanced and evolved species. It is equally embarrassing to creationists who insist that man was made in the Image of God. If man is the most advanced and evolved animal why do our babies take so long to learn to walk? Why are we, the “peak of God’s creation” carried around by our mothers for a year while the zebras and goats and horses are proudly walking and cavorting just hours after delivery? Creationists have a ready excuse-the fall of man and his expulsion from the Garden of Eden caused man to become genetically degraded [1]. After all, they argue, the first humans Adam and Eve walked and talked the very day they were created. Evolutionists on the other hand put forth other arguments for the very embarrassing ambulatory limitations of Homo sapiens. I hereby refute these arguments viz-Refuting the gestation argument-This argument states that humans are pregnant for 9 months unlike those other animals that are pregnant for shorter periods. However, baby elephants walk hours after birth and the gestation period in elephants is 18 to 22 months! Refuting the Life Span Relativity Argument This argument states that because horses and dogs have shorter life spans than we humans their apparent early walking is not really that early [2]. I refute this argument in the table below by showing at what age human babies would walk if we had the life span of cats and dogs etc table 1.

Refuting the Brain Development Argument

This argument states that all animals start walking when their brains reach a particular stage of development [3]. Then why do humans reach the stage so late if we are the most evolved animal?

Refuting the Bipedal Argument

This argument states that walking on two legs involves much more balance and coordination than walking on all fours and so should take longer. If this argument was true human babies would start crawling hours after birth! Human babies don’t crawl till 4 -7 months! Also studies by Francesco Lacquaniti at the University of Rome Tor Vergata, Italy have shown that despite homo sapiens’ unique gait, the motor patterns controlling walking in other animals are nearly identical to that in man!

Intelligence Argument

This argument claims that since humans are more intelligent than other animals we have to start walking later because we have so many other things to do with our minds apart from walking [4-7]. However, ravens are very intelligent birds yet raven chicks walk and fly at one month old. Monkeys are intelligent and yet start waking at 6 weeks!

MY HYPOTHESIS AND PROPOSAL

The key to cracking this mystery will be to do a comparative study of the cellular dust [8-10] of various animals. This is not likely to happen any time soon however as the mainstream scientific community continues to deny
the existence of the microzymas [11].

More information regarding this Article visit: OAJBGSR


https://biogenericpublishers.com/pdf/JBGSR.MS.ID.00254.pdf
https://biogenericpublishers.com/jbgsr-ms-id-00254-text/

Tuesday, 28 June 2022

Marine Drugs as a Valuable Source of Natural Biomarkers Used in the Treatment of Alzheimer’s Disease by UMA NATH U* in Open Access Journal of Biogeneric Science and Research

Marine Drugs as a Valuable Source of Natural Biomarkers Used in the Treatment of Alzheimer’s Disease by UMA NATH U* in  Open Access Journal of Biogeneric Science and Research 


ABSTRACT

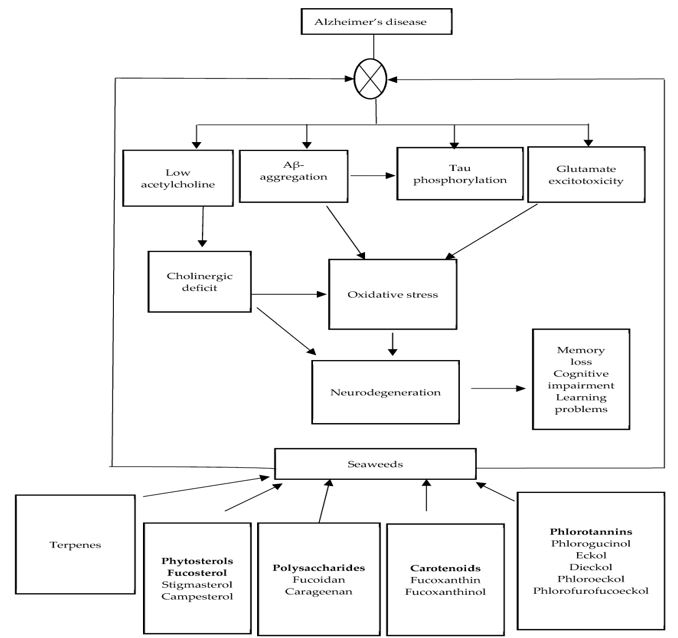
Alzheimer’s disease (AD) is a multifactorial neurodegenerative disorder. Current approved drugs may only ameliorate symptoms in a restricted number of patients and for a restricted period of time. Currently, there is a translational research challenge into identifying the new effective drugs and their respective new therapeutic targets in AD and other neurodegenerative disorders. In this review, selected examples of marine-derived compounds in neuro degeneration, specifically in AD field are reported. The emphasis has been done on compounds and their possible relevant biological activities. The proposed drug development paradigm and current hypotheses should be accurately investigated in the future of AD therapy directions.

KEYWORDS: Marine drugs; Alzheimer’s disease; Mechanisms of activity

Introduction

Right now, 46.8 million persons in the world are suffering from dementia and it is expected that this number will increase to 74.7 million in 2030 and 131.5 million in 2050. Alzheimer’s disease (AD) is the main cause of dementia in the elderly. AD is a progressive, continuous and incurable brain disorder leading to increase severe disability such as memory loss (amnesia), minimal to no communication (aphasia), the inability to perform activitiesofdaily living (ADL) (apraxia), the impairment of the sensory input (development of agnosias). In briefly, AD is a multifactorial neurodegenerative disorder that affects cognition (memory, thinking, and language abilities), quality of life and self-sufficiency in elderly [2]. AD is strictly related to aging, indeed the majority of cases (≥ 90%) are initially diagnosed among persons ≥ 65 years of age (AD with late onset-LOAD). In particular, genes involved in the production of the amyloid β (Aβ) peptides such as amyloid precursor protein (APP), Presenilin 1 (PSEN1), and 2 (PSEN2) may account for as much as 5%–10% of the EOAD incidence.

BRYOSTATIN

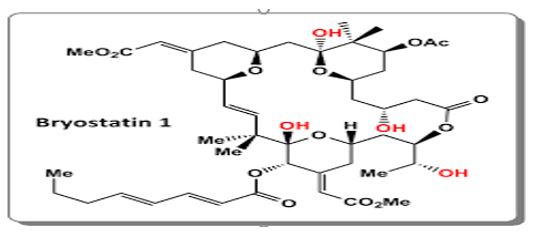
Bryostatin 1 is a natural product derived from the marine invertebrate Bugula neritina. It has potent and broad antitumor activity. Bryostatin 1 activates protein kinase C family members, with nanomolar potency for PKC1α and ε isotypes.

In the central nervous system, bryostatin 1 activation of PKC boosts synthesis and secretion of the neurotrophic factor BDNF, a synaptic growth factor linked to learning and memory. The compound also activates nonamyloidogenic, α-secretase processing of amyloid precursor protein.

Preclinical work on bryostatin in nervous system diseases has mainly come from the Alkon lab. In their studies, intraperitoneal administration activated brain PKCε and prevented synaptic loss, Aβ accumulation, and memory decline in Alzheimer’s disease transgenic mice. he drugs preserved synapses and improved memory in aged rats, and in rodent models of stroke and Fragile X syndrome. In a different lab, bryostatin given by mouth improved memory and learning in an AD model. In a mouse model of multiple sclerosis, bryostatin promoted anti-inflammatory immune responses and improved neurologic deficits.

MACROALGAE

Acetylcholinesterase (AChE) and butyrylcholinesterase (BChE) are important enzymes involved in the regulation of acetylcholine (ACh) in the cleft of neurons to promote cognitive function. However, loss or rapid degradation of acetylcholine leads to cholinergic dysfunction and synaptic ultimately memory impairment. Hence, cholinesterases have been developed to alleviate cholinergic deficit by restoring ACh levels and improving cognitive function Seaweed-derived biologically active compounds have been reported to exhibit inhibitory effects on enzymes associated with Alzheimer’s disease. revealed that aqueous-ethanol extracts rich in phlorotannins, phenolic acids, and flavonoids from Ecklonia maxima, Gelidium pristoides, Gracilaria gracilis, and Ulva lactuca exhibit acetylcholinesterase and butyrylcholinesterase inhibitory activities. Furthermore, sulfated polysaccharides obtained from Ulva rigida as well as the aforementioned algal species also showed potent inhibitory effects on BChE and AChE in vitro. Purified fractions of Gelidiella acerosa showed AChE and BChE inhibitory activity. Phytol was identified in the fraction as the most effective constituent. In the same study, molecular docking analysis revealed that phytol tightly binds to the arginine residue at the active site of the enzyme, thereby changing its conformation and exerting its inhibitory effect. AChE inhibitory activity of Codium duthieae, Amphiroa beauvoisii, Gelidium foliaceum, Laurencia complanata, and Rhodomelopsis africana. Hypnea musciformis and Ochtodes secundiramea extracts showed weak inhibitory activity (less than 30% inhibition) on AChE. Jung et al. also reported AChE and BChE inhibitory effects of methanol extracts of Ecklonia cava, Ecklonia kurome, and Myelophycus simplex. Glycoprotein isolated from Undaria pinnatifida showed dose responsive inhibitory effects on butyrylcholinesterase and acetylcholinesterase activities.

MEDITERRANEAN RED SEAWEED HALOPITHYS INCURVA

The close relationship between the amyloid aggregation process and the onset of amyloidosis constantly encourages scientific research in the identification of new natural compounds capable of suppressing the formation of toxic amyloid aggregates. For the first time, our findings demonstrated the in vitro anti-amyloidogenic role of the H. incurva, whose metabolic composition and bioactivity were strongly influenced by seasonality. This work focused on the bioactivity of H. incurva phytocomplex to evaluate the synergistic action of its various constituents, while the structure and functionality of its secondary metabolites will be the subject of further studies.

FASCAPLYSIN

Fascaplysin, a bis-indole alkaloid, was isolated from a marine sponge Fascaplysinopsis Bergquist sp. Fascaplysin is a specifc kinase inhibitor for CDK 4.

More information regarding this Article visit: OAJBGSR


https://biogenericpublishers.com/pdf/JBGSR.MS.ID.00253.pdf
https://biogenericpublishers.com/jbgsr-ms-id-00253-text/

Tuesday, 21 June 2022

Forest Biodiversity Degradation: Assessment of Deforestation in Ohaji Egbema Forest Reserve, Imo State, Nigeria Using GIS Approach by Egbuche Christian Toochi in Open Access Journal of Biogeneric Science and Research

Forest Biodiversity Degradation: Assessment of Deforestation in Ohaji Egbema Forest Reserve, Imo State, Nigeria Using GIS Approach by Egbuche Christian Toochi in Open Access Journal of Biogeneric Science and Research 


ABSTRACT

This research is focused on a spatial analysis of a reserved forest deforestation over a period of time using a GIS approach in Ohaji Egbema Local Government Area Imo state, Nigeria. It aimed at assessing and analyze deforestation in Ohaji Egbema forest reserve and examined the possible effects of deforestation on the forest environment. The assessment concentrated on when and where have forestlands changed in the reserved forest programmed within the period of 1984 - 2040 forecast. The key objectives were to assess the impact of land use and land cover changes on forest cover for the past 36 years, while sub objectives were dedicated to achieve in mapping out different land cover in Ohaji Egbema forest reserve, to assess land cover changes in the forest reserve susceptible to long term degradation from 1984 to 2020 of about 20 years. To evaluate forest loss in the area for the past 36years, and to predict the state of the land cover (forest) for the next 20 years (2040). Primary and secondary data employed using (200 ground truth points) were systematically collected from four different LULC classes in the study area using geographical positioning system (GPS), the secondary data (Satellite Landsat Imageries of 1984, 2002 and 2020) of the study area was acquired. The imageries were processed, enhanced and classified into four LULC classes using supervised classification in Idrisi and ArcGis software Ground truth points were utilized to assess the accuracy of the classifications. The data collected was analyzed in tables and figures and represented with a bar chart and pie chart graphs. Results showed that forest land, built up, grassland and water body were the four LULC classified in the study area. Kappa coefficient values of 91%, 85% and 92% for 1984, 2002 and 2020 respectively shows the accuracy of the classifications. Classifying the land uses into built-up and forest lands revealed that the built-up lands constantly rose while the forest lands kept dropping. The built-up lands increased by 49.30% between 1984 and 2000, 50.00% between 2002 and 2020 and 28.40% between 2020 and 2040 at the expense of the forest portion of the area which fell by 33.88% between 1984 and 2000,46.45% between 2002 and 2020, and 49.22% between 2020 and 2040. Increase in population, per capita income, and land use activities and by extension urban expansion were found to be the major factors causing deforestation in the forest reserve, it is likely that in the nearest future the remaining forest lands would be gradually wiped out and consequently the environmental crisis would be aggravated. Based on the findings of the study, there is need to urgently limit and control the high rate of deforestation going on in Ohaji Egbema forest reserve and embark on tree replanting campaigns without delay. There is need and recommended that a higher quality satellite imagery that offers up to 4m resolution should be used and a forest relic analysis should be conducted.

KEYWORDS: Biodiversity; Forest degradation; GIS; Forest Reserve; LULC; Deforestation and Satellite Imagery

Introduction

Deforestation constitutes one of the serious threats to forest biodiversity and pose a global development challenges of long-term environmental problem at both regional level and the world at large. According to [1] and [2] the degradation of the forest ecosystem has obvious ecological effects on the immediate environment and forested areas. Deforestation can result in erosion which in turn may lead to desertification. The economic and human consequences of deforestation include loss of potential wood used as fuel wood for cooking and heating among others. The transformation of forested lands by human actions represents one of the great forces in global environmental change and considered as one of the great drivers of biodiversity loss. Forests are cleared, degraded and fragmented by timber harvest, conversion to agriculture, road-construction, human-caused fire, and in myriad of other ways of degradation. According to [5], deforestation refers to the removal of trees from afforested site and the conversion of land to another use, most often agriculture. There is growing concern over shrinking areas of forests in the recent time [7]. The livelihoods of over two hundred million forest dwellers and poor settlers depend directly on food, fibre, fodder, fuel and other resources taken from the forest or produced on recently cleared forest soils. Furthermore, deforestation has become an issue of global environmental concern, in particular because of the value of forests in biodiversity conservation and in limiting the greenhouse effect [8]. Globally, deforestation by this trend has been described as the major problem facing the forest ecosystem. The extent of deforestation in any particular location or region can be viewed from economic, ecological and human consequences as well as scramble for land. Forest degradation may in many ways be irreversible, because of the extensive nature of forest degradation which the impact of activities altering their condition may not be immediately apparent and as a result they are largely ignored by those who cause them. Forest is often perceived as a stock resource and always and freely available for conversion to other uses without considering the consequences for the production services and environmental roles of the forest. As environmental degradation and its consequences becomes a global issue, the world is faced with the danger that the renewable forest resources may be exhausted and that man stands the risk of destroying his environment if all the impacts of deforestation are allowed to go unchecked. It becomes therefore important to evaluate the level of deforestation and degradation in Ohaji Egbema forest reserve using a GIS application. The effect of deforestation and degradation of the only forest reserve in South east Nigeria has recently become a serious problem. It has been identified that in the area is mostly the quest for fuel wood, grazing and for agricultural use. One of the effects of deforestation is global warming which occurs as a result of deforestation as trees uses carbon dioxide during photosynthesis. Deforestation leads to the increase of carbon dioxide in the environment which traps heat in the atmosphere leading to global warming. I become very objective to assess the impact of land use and land cover changes on forest cover for the past 36 years with further interest to map out different land cover in the Ohaji Egbema forest reserve, assess land cover changes from 1984 to 2020 at 20 years, evaluate forest loss in the area for the past 36 years and make a prediction of the state of the land cover (forest) for the next 20 years (2040). It is known that deforestation and degradation of the forest has posed a serious problem especially at this era of global climatic change.

United Nations Food and Agricultural Organization [12], deforestation can be defined as the permanent destruction of forests in other to make the land available for other uses. Deforestation is said to be taking place when forest is being cut down on a massive scale without making proportionate effort at replanting. Also, deforestation is the conversion of forest to an alternative permanent non-forested land use Such as agriculture, grazing or urban development [5]. Deforestation is primarily a concern for the developing countries of the tropics [6] as it is shrinking areas of the tropical forests [3] causing loss of Biodiversity and enhancing the greenhouse effect [8]. Forest degradation occurs when the ecosystem functions of the forest are degraded but where the area remains forested rather cleared [9]. Available literatures shows that the causes of forest deforestation and degradation are caused by expansion of farming land, logging and fuel wood, overgrazing, fire/fire outbreak, release of greenhouse gases and urbanization/industrialization as well as infrastructural provisions. More so agents of deforestation in agricultural terms include those of slash and burn farmers, commercial farmers, ranchers, loggers, firewood collectors etc. Generally, the center of biodiversity and conservation (CBC 1998) established the remote sensing and geographic information system (RS/GIS) facilities as technologies that will help to identify potential survey sites, analyze deforestation rates in focal study areas, incorporate spatial and non-spatial databases and create persuasive visual aids to enhance reports and proposals. Change detection is the process of identifying differences in the state of an object or phenomenon by observing it at different times [11]. Change detection is an important process in monitoring and managing natural resources and urban development because it provides quantitative analysis of the spatial distribution of the population of interest.

Study Area

Ohaji Egbema lies in the southwestern part of Imo state and shares common boundaries with Owerri to the east, Oguta to the north Andogba/Egbema/Ndoni in Rivers state in the southwest. The 2006 census estimated the study area to over 182,500 inhabitants but recently due to industrialization and urbanization, Ohaji/Egbema has witnessed a great deal of population influx. The study area lies within latitudes 50 11’N and 50 35’N and longitudes 6037’ ad 6057’. It covers an area of about 890km2.

The study area is largely drained by the Otammiri River and other Imo river tributaries. The study area belongs to a major physiographic region- the undulating lowland plain which bears a relationship with its geology. The low land areas are largely underlain by the younger and loosely consolidated Benin formation [12]. The vegetation and climate of the study area has been delineated to have 2 distinct seasons both of which are warm, these are the dry and rainy season.

Climate and Vegetation

The dry season occurs between November and March, while the rainy season occurs between April and October. The high temperatures, humidity and precipitation of the area favour quick plant growth and hence vegetation cover of the area that is characterized by trees and shrubs of the rainforest belt of Nigeria.
Geology and Soil

The study area is located in the Eastern Niger delta sedimentary basin, characterized by the three lithostratigrapgic units in the Niger delta. These units are – Akata, Agbada and Benin formation in order of decrease in age [13]. The overall thickness of the tertiary sediments is about 10,000 meters.
 

Method of Data Collection

Data are based on field observation and from monitoring the real situation, they are collected as fact or evidence that may be processed to give them meaning and turn them into information in line with [14]. Heywood (1988). Geographical Positioning System (GPS) was used to collect fifty (50) coordinate points at each land use land cover, totaling 200 points for the four major land use and land cover identified in the study area. Landsat Imageries of one season (path 188, 189 and row 56) were acquired from United State Geological Survey (USGS) in time series; 1984 Thematic Mapper (Tm), 2002 Enhanced Thematic Mapper (ETM) and 2020 Operational Land Imager (OLI) as shown in the table one below table 3.

 Data Analysis and Data Processing

The acquired landsat imageries were pre-processed for geometrical corrections, stripes and cloud removal. Image enhancement was carried out on the acquired imageries employing bands 4, 3, 2 for LANDSAT TM and ETM while bands 5, 4, 3 for LANDSAT OLI/TIRS to get false colour composite using Idrisi and Arcgis softwares. In the resultant false colour composite, built up areas appear in cyan blue, vegetation in shades of red differentiating dense forest and grass or farm lands, water bodies from dark blue to black, bare lands from white to brown [15]. This was necessary to enhance visualization and interpretability of the scenes for classification. The study area was clipped out using administrative map of Nigeria containing Imo State and Local Government shape files in Arc map (Table1 and table 2).

Table: 1. Details of Landsat Imageries Dataset used

Table: 2. Change Observed between (1984 – 2002).

Table: 3. Change Observed between (2002 – 2020).

Land Use Land Cover Classification

The false Colour composite images were subjected to supervised classification which was based on ground-based information. Maximum likelihood was adopted to define areas of Landsat images that represented thematic classes as determined by maximal spectral heterogeneity according to [16]. Maximum likelihood algorithm considers the average characteristics of the spectral signature of each category and the covariance among all categories, thus allowing for precise discrimination of categories. Hence the land covers were classified into four major land use land cover classes: Built up, forest cover, grass cover and water body. Forest vegetation are the areas dominated by trees and shrubs; grass land are the areas dominated by grasses, including farm lands and gardens; water body are the areas occupied by streams, rivers, inland waters; while built-up areas are the areas occupied by built structures including residential, commercial, schools, churches, tarred roads and those land surface features devoid of any type of vegetation cover or structures including rocks. Four applications (ArcGis 10.5, Idris software, Excel and Microsoft word) were also applied in this study.

Accuracy Assessment of The Classification

The aim of accuracy assessment is to quantitatively assess how effectively the pixels were sampled into the correct land cover classes. Confusion matrix was used for accuracy assessment of the classification procedure in accordance with the training samples and the ground truth points as a reference point. This approach has also been adopted effectively in similar studies by [17]; [18]. The accuracy assessments of the classified maps for 1984, 2002 and 2020 were evaluated using the base error matrix. The base error matrix evaluates accuracy using parameters such as agreement/accuracy, overall accuracy, commission error, omission error and the Kappa coefficient. The agreement/accuracy is the probability (%) that the classifier has labeled an image pixel into the ground truth class. It is the probability of a reference pixel being correctly classified. The overall accuracy specifies the total correctly classified pixels and is determined by dividing the total number of correctly classified pixels by the total number of pixels in the error matrix. Commission error represent pixels that belong to another class but are labeled as belonging to the class; while the Omission error represent pixels that belong to the truth class but fail to be classified into the proper class. Finally, the Kappa coefficient (Khat) measures the agreement between classification map and reference data, as expressed below:

kappa coefficient t= (Observed Accuracy-Chance agreement)/ (1-Chance agreement)

It is stated that Kappa values of more than 0.80 (80%) indicate good classification performance. Kappa values between 0.40 and 0.80 indicate moderate classification performance and Kappa values of less than 0.40 (40%) indicate poor classification performance [19].

Change Detection Analysis

Spatio-temporal changes in the four classified land use classes for the past 36 years were analyzed through comparison of area coverage of the classified maps. Change detection was carried out in each of the classes to ascertain the changes over time in terms of area and percentage coverage according to [18]. This was done by computing the area coverage for each of the feature class in each epoch from the classified images in idrisi and Arcmap softwares following the expression below:

Area (m2) = (Cell Size x Count)/10,000

Percentage cover (%) = Area/ (Total) x100

Where cell size and count were gotten from the properties of the raster attributes.

The extent of land use land cover over change, land use encroachment as well as gains and losses experienced within the study period were analyzed and presented in maps and charts.

Prediction Analysis

The classified land use imageries were subjected for Land Change Modeling in idrisi software using Cellular Automata and Markov Chain algorithm for prediction. Then land cover scenario under prevailing conditions for the year 2040 was modeled table 6.

Table: 4. Change Observed between (2020 - 2040).

Table: 5. 1984 Land use land cover classification accuracy

 Table: 6. 2002 Land use land cover Classification Accuracy

Table: 7. 2020 Land use land cover classification accuracy

RESULTS AND DISCUSSION LAND COVER LAND USE CHANGES LASSIFICATION FROM 1984-2040

The result of the work is presented starting with the land use and land cover classification in the years 1984,2002,2020 and 2040 presented in Figures 4.1,4.2,4.3 and 4.4 below. Dark green colour represents forest vegetation, light green represents grass lands, blue represent water body, while orange colour represent built-up area. In figure 4.1 which is the LULC classification of 1984 shows that the study area is largely covered with deeply dark green which is forest vegetation, patches of scattered light green and orange colour which is grass land and built-up while the blue colour which is the water bodies covers a little part of the study area. This depict that the study area was more of forest vegetation in 1984 table 7.

Figure:

In figure 4.2, it is observed that dark green colour is reduced, there was a slight increase in blue colour, and there was a slight reduction inlight green colour, while the orange colour was at an increase rate mainly at Obofia, Awarra, Amafor, Ohoba, Umukani, Ohaji Egbema forest reserve and Adapalm axis. This indicated that by the year 2002, reasonable forest lands were deforested and converted to residential, commercial, Agricultural and other land uses, and this could be attributed to infrastructural development, urbanization, industrialization and human population increase in the area which is the causes of deforestation table 4 and table 5.

Figure: 2. The land use land cover classification of the year 1984

In fig 4.3, deforestation continued. There were more of orange colours and light green colors were observed more at Umukani and Umuakpu axis in the map, while the dark green colour is gradually decreasing and it’s been observed that the blue colour was rarely seen in the map. These indicated that as the years passes by, there are more built ups, and grass lands while the forest land is gradually degraded and used for built-up and agricultural purposes.


Figure: 3. The land use land cover classification of the year 2002

In figure 4.4 below, the whole map is mostly covered with orange colour, with scattered patches of light green, and dark green colour being deforested, while the blue colour is hardly seen in the map. This shows that the forest land cover has been on the regular decrease, while built ups, grass lands have been on the regular increase.

Figure: 4. Land use land cover classification of 2020

Area coverage, percentage cover and change detection land use and land cover 1984 - 2040

The area coverage and percentage cover of different land use classes are represented below. It is observed that the forest land covers about 723.26km2 with a percentage cover of 81.31% which was the major land cover of the study area in 1984. This implies that more than half of the study area was under forest cover in 1984, In the areas of built-up, it covers about 128.40km2 in 1984 with a percentage cover of 14.43%. Areas covered by grass land (either by sparse vegetation, farmland or grasses) was at minimal in 1984 with an area cover of 32.57km2 and percentage cover of 3.66%, while the water bodies cover an area of 5.34km2 and a percentage cover of 0.6%.

Figure: 5. The land use land cover classification of 2040

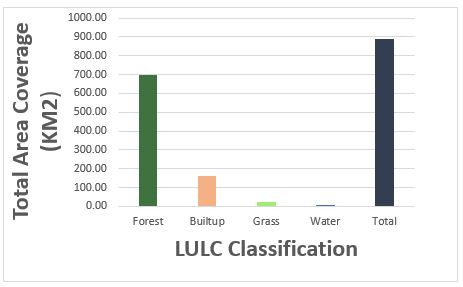
Figure 4.7 and 4.8 below show the area coverage and percentage coverage of the year 2002. As time goes on, the forest land decrease from area coverage of 723.26km2 in 1984 to 699.68km2 in 2002, with a percentage cover of 81.31% in 1984 to 78.68% in 2002 which depict that the forest cover was at a loss while the built–up was at increase from 128.40km2 to162.46km2 and a percentage cover of 18.26%. Areas covered by grass land gradually decrease to 21.41km2 with a percentage cover of 2.41% in 2002, and a slight increase of the water bodies from an area cover of 5.34km2 to 5.80km2 with a percentage cover of 0.65%.

Figure: 6. 1984 Area coverage of different land use classes

Figure: 7. Percentage cover of 1984 LULC Classification

In the year 2020, it is shown that the forest land covers about 589.73km2 with a percentage cover of 66.30% which shows that there was a decrease within 2002 to 2020 while in the area of built up it increased to an area cover of 280.98km2 with a percentage cover 31.59%. An area covered by grass land covers about 15.53km2 with a percentage cover of 1.75% and the water bodies cover about 3.27km2 and a percentage cover of 0.37%. This shows that the built-up area which is at increase were initially forest lands and water bodies in the past years.

Figure: 8. 2002 Area coverage of different land use classes

Figure: 9. Percentage covers of 2002 LULC Classification

In 2040 it was predicted that the forest cover about 497.67km2 with a percentage cover of 55.95%, the built up was predicted to be on the increase with an area cover of 334.11km2 and a percentage cover of 37.56%. Area covered by grassland was at predicted to be on increase with an area cover of 55.92km2 and a percentage cover 6.29% and this grass land was formally forest land in the past years and this change occurred mainly at Ohoba, Awarra, Umuakpu, Umukani and Ohaji Egbema forest reserve the only forest reserve in the south east of Nigeria which has been deforested and use for agricultural purposes. The water bodies cover about 1.82km2 with a percentage cover of 0.20%. This implies that the forest land has been deforested and degraded to other land uses in the study area within the study periods. All this are shown in figure 4.11 and figure 4.12.

Figure: 10. 2020 Area coverage of different land use classes

Figure: 11. Percentage cover of 2020 LULC Classification.

Change Detection Observed Between (1984-2040)

Approximately the change detected in the forest land from 1984 to 2002 in the area coverage is 23.41km2 with a percentage change of 33.88% which shows it was at decrease, the built up from 1984 to 2002 the change detected in area is -34.06km2 with a percentage change of 49.30% which is at increase while in the area of grassland, the change observed is 11.16km2 with a percentage change of 16.15%. The change detected in the area coverage of water bodies from 1984 to 2002 is -0.46km2 with a percentage coverage of 0.67% which was at increase.

The change detection observed in table 2 below shows that between 2002 to 2020 the forest cover was at a high decrease with about 110.12km2 of change observed and a percentage change of 46.45% and the built up was about -118.53km2 and a percentage change of 50.00% which shows there was an increase in the area. The change observed in the grass was at 5.88km2 with a percentage cover of 2.48% which is at a decrease while for the water bodies the change observed is 2.53km2 with a percentage change of 1.07% which implies that the area of built up has been on the high increase over other land classes.

In the 2020 to 2040 change detection table shows that there was more of built up in the study area which is observed to cover about -53.12km2 with a percentage change of 28.40% which shows that the built up was at increase, and the forest cover was at decrease with the change observed at 92.06km2 and a percentage change of 49.22%.Also the grassland was detected to be on a increased with about -40.39km2 with a percentage change of 21.60% and the water bodies was at a decrease with the change detected at the study period to be about 1.45km2 and a percentage change of 0.78% which implies that the water body has been lost to other land uses.

Figure: 12. Predicted 2040 Area coverage of different land use classes

Figure: 13. Predicted Percentage cover of 2040 LULC Classification

Land Use Land Cover Classification Accuracy

The result of the accuracy assessment for 1984, 2002 and 2020 were presented in table 4 to table 6below. The overall accuracy for 1984 classification was 0.94%, with overall kappa accuracy of 91%, in 2002 classification, overall accuracy 0.89%, kappa accuracy was 85%, in 2020 classification, overall accuracy was 0.94%, kappa accuracy was 92%.

Figure: 14. General view of Area Coverage 1984 – 2040

Discussion

Findings from the study showed that land cover of the study area has been heavily deforested and degraded within the study period 1984, 2002 and 2020, which will continue if control measures are not taken into consideration. Forest land was on the decrease while built ups and grass lands were on the increase. This is in line with other findings of [16] and [23] and [30]. These outrageous changes in the origin all and cover in the study area could be linked to human population, unsustainable human activities in the study area as well as unsustainable environmental management practices and weak environmental policies. As the human population increases, more lands were needed for settlements and many other commercial activities, which gradually led to rapid industrialization, infrastructural development and urbanization. Increase in human population could also increase the levels of anthropogenic activities such as deforestation, intensive farming and sand mining. In other words, the large spread of forest land in 1984 could be linked to low population and productivity, less socio-economic activity. The forest lands have been drastically reduced to build-ups and other land uses in the study area, without consideration to the many environmental needs that forest provides. Hence loss of biodiversity, land degradation, noise pollution, air pollution and climate change could be rooted to changes in the land cover. It can observe that in the past two centuries the impact of human activities on the land has grown enormously, altering entire landscapes, and ultimately impacting the earth's nutrient and hydrological cycles as well as climate. The classification accuracy for the 3 years represents strong agreement. According to [31] values between 0.4 and 0.8 represent moderate agreement, values below 0.4 represent poor agreement and values above 0.81 represent strong agreement.

CONCLUSION AND RECOMMENDATION

In this study, four land use land cover classes were identified as they change through time. However, the result shows a rapid change in the vegetation cover of the study area between 1984 to 2040. Within this period, 225.59km2 of forest land areas and 3.52km2 of water body were lost and converted to other land uses in the study area. Whereas built up and grassland was at increase covering part of the forest and water body. However, if these patterns of degradation continue in the study area, it is likely that in the nearest future the remaining forest land would be wiped out and environmental crisis would be aggravated. Therefore, the assessment of the level of deforestation in Ohaji Egbema using GIS is thus a vital tool for sustainability of the forest management and environmental planning of the area especially at the only forest reserve in the South east, Nigeria.


Based on the findings, there is need to urgently limit and control the high rate of deforestation going on in Ohaji Egbema and embark on tree planting campaigns without delay. It is also recommended that an Environmental Impact statement (EIS) should be carried out. Furthermore, policy makers should ensure that the existing/future polices with regard to environmental and forest degradation is utmost implemented. There is need to create an awareness programme for all stakeholders on the issues at hand and the need to adopt sustainable use of natural resources, sustainable living habits and minimizing impact on the environmental. Finally, [2] having conducted species relics in this forest reserve further research should be conducted on higher quality satellite imagery that offers up to 4m resolution within as well as forest relic analysis.

More information regarding this Article visit: OAJBGSR


https://biogenericpublishers.com/pdf/JBGSR.MS.ID.00252.pdf
https://biogenericpublishers.com/jbgsr-ms-id-00252-text/